Project Details
🔹 1. SQL Data Extraction
This stage involved querying the tickets table to gather strategic insights, moving from a general understanding of total sales to more detailed product and customer behavior analyses.
🔸 0. Understanding the Data
SELECT * FROM tickets LIMIT 100;🔸 1. Overall Sales Overview
Key metric: Total Revenue Generated
SELECT SUM(precio_total) AS total_revenue FROM tickets;🔸 2. Monthly Sales Trends
To assess revenue evolution over time:
SELECT strftime('%Y-%m', fecha) AS month, SUM(precio_total) AS monthly_revenue
FROM tickets
GROUP BY month
ORDER BY month;
🔸 3. Department and Section Analysis
Breakdown of revenue by department:
SELECT id_departamento, SUM(precio_total) AS department_sales
FROM tickets
GROUP BY id_departamento
ORDER BY department_sales DESC;
Sales by product section:
SELECT id_seccion, SUM(precio_total) AS section_sales
FROM tickets
GROUP BY id_seccion
ORDER BY section_sales DESC;
🔸 4. Product Analysis
Top 10 products by quantity sold:
SELECT nombre_producto, SUM(cantidad) AS total_sold
FROM tickets
GROUP BY nombre_producto
ORDER BY total_sold DESC
LIMIT 10;
Top 10 products by revenue:
SELECT nombre_producto, SUM(precio_total) AS product_revenue
FROM tickets
GROUP BY nombre_producto
ORDER BY product_revenue DESC
LIMIT 10;
🔸 5. Customer Behavior
Top 20 clients by revenue:
SELECT id_cliente, SUM(precio_total) AS client_revenue
FROM tickets
GROUP BY id_cliente
ORDER BY client_revenue DESC
LIMIT 20;
Average spend per client:
SELECT AVG(client_total_purchase) AS avg_per_client
FROM (
  SELECT id_cliente, SUM(precio_total) AS client_total_purchase
  FROM tickets
  GROUP BY id_cliente
) AS subquery;
🔸 6. Order Analysis
Total number of orders:
SELECT COUNT(DISTINCT id_pedido) AS total_orders FROM tickets;Average order value:
SELECT AVG(order_total) AS avg_order_value
FROM (
SELECT id_pedido, SUM(precio_total) AS order_total
FROM tickets
GROUP BY id_pedido
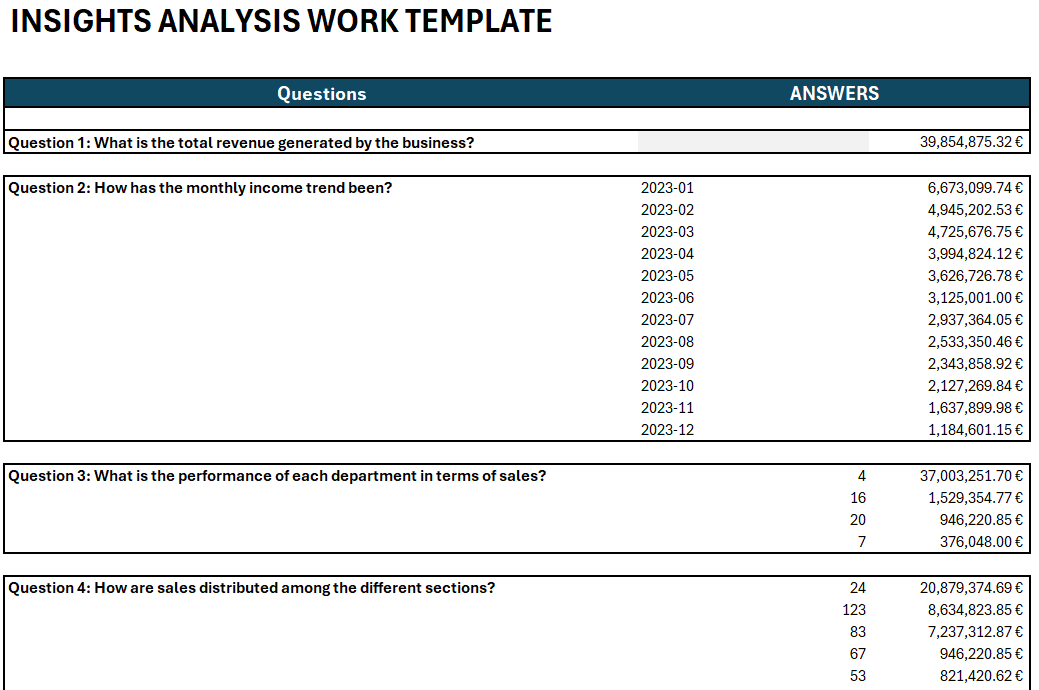
) AS subquery;🔹 2. Excel for Data Documentation
After executing SQL queries, Excel was used as a workspace to record and organize the query results. This allowed for a clear visualization of the data outputs before building the dashboard and writing the report.
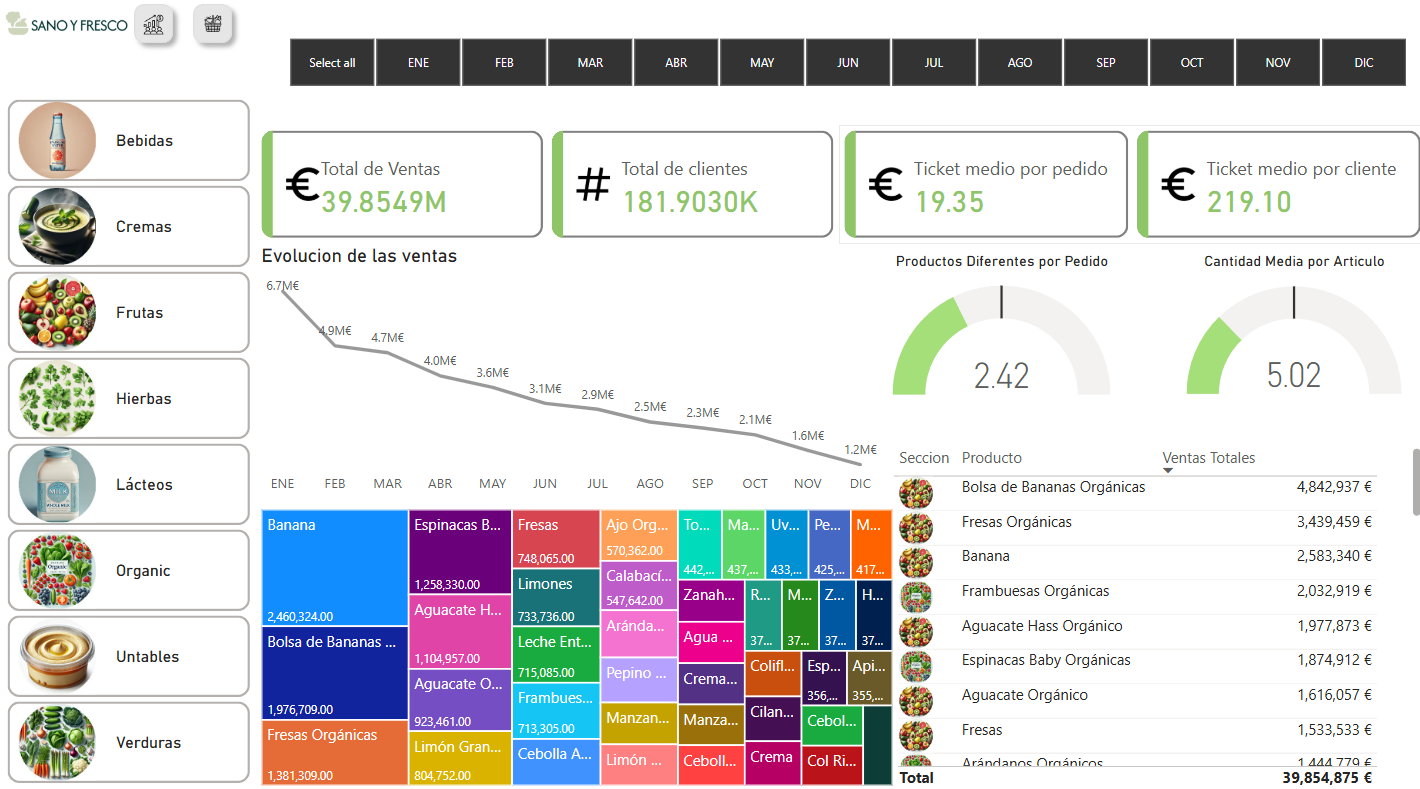
🔹 3. First Power BI Dashboard
Once the SQL queries were validated and the metrics were clearly documented in Excel, the next step was to create an interactive dashboard in Power BI, connecting directly to the SQLite database via an ODBC (Open Database Connectivity) driver.
🔹 4. Strategic Business Report
Following the development of the dashboard, a strategic report was created to communicate insights clearly to the company’s executive board. The report was structured into three key parts:
Executive Summary
The business generated a total of €39,854,875.32 in revenue over the year.
However, the analysis revealed a significant downward trend in monthly revenue, highlighting urgent challenges in the company’s current sales strategy.
Key Insight:
Revenue declined by 82% from January to December, signaling a critical need for diversification and strategic reorientation.
Conclusions & Recommendations
Main Risks Identified:
- Excessive reliance on a single department (93% of revenue from Department 4)
- High concentration of sales in a few product sections (92% in Sections 24, 123, and 83)
- Low customer spend (average ticket per order: €19.34)
Strategic Recommendations:
- Diversify Departments and Sections
Action: Promote underperforming departments and product lines
Benefit: Reduces business risk by spreading revenue sources - Expand Product Portfolio
Action: Introduce new, non-organic products and stimulate sales of lower-demand items
Benefit: Broadens customer base and adapts to market trends - Increase Average Ticket Size
Action: Implement an analytical recommendation system
Benefit: Drives up customer value and encourages loyalty
🔹 5. Data Automation with Python
In this stage, I implemented a custom Market Basket Analysis pipeline in Python focused on product co-occurrence, with a strong emphasis on direct database integration, data transformation, and the development of logic-based metrics (confidence and lift) — all tailored to real transactional data.
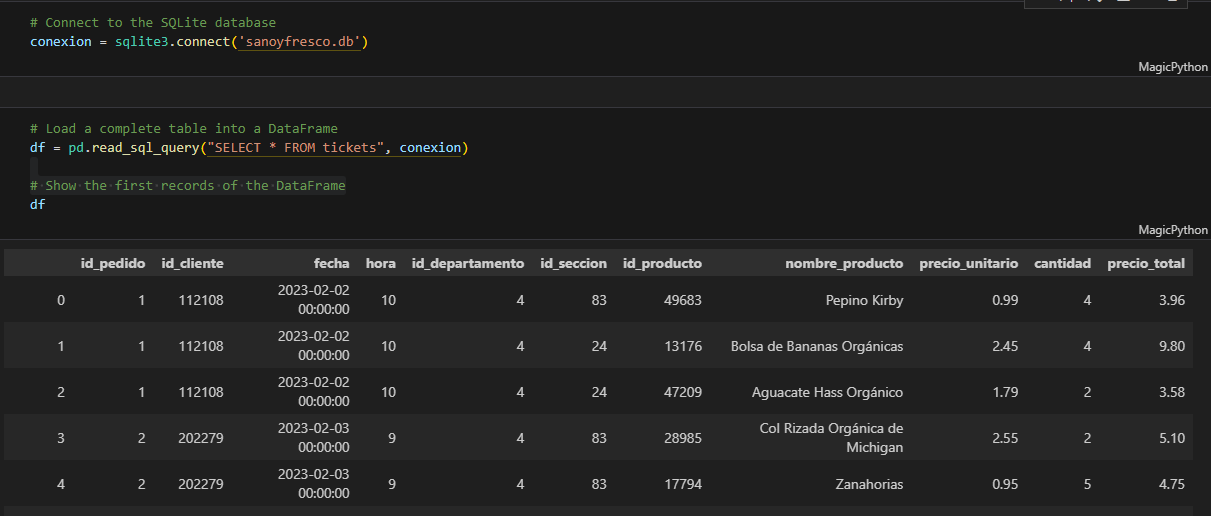
Direct Integration with SQLite3
A key part of this process was establishing a live connection to the company’s transactional database using the sqlite3 library. This allowed direct querying and retrieval of the full tickets table — containing information on orders, products, departments, and sections — without relying on intermediate file exports (e.g., CSVs or Excel).
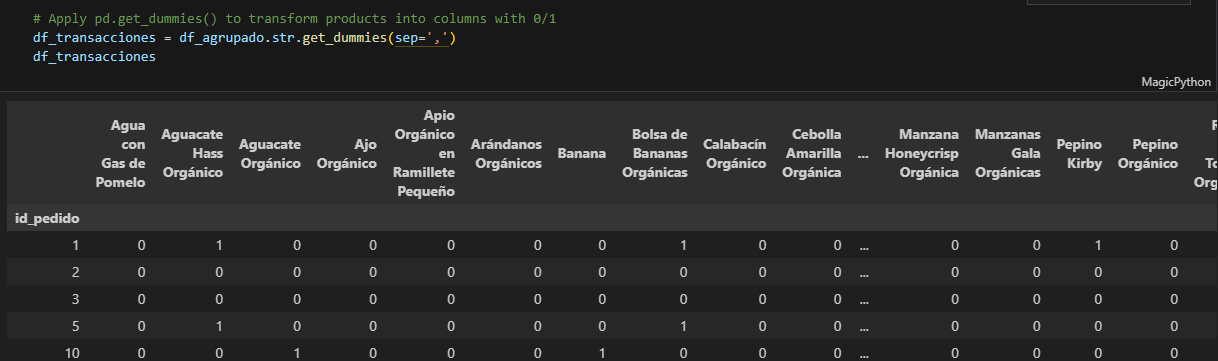
Transforming Orders into a Basket Matrix
Once the data was in Python, I reshaped the dataset to simulate individual shopping carts. This was done by grouping products by order ID and creating a structured format that lists all products purchased together.
To analyze product relationships, the grouped data was converted into a binary matrix using one-hot encoding (get_dummies). In this matrix:
- Each row represented a transaction
- Each column represented a product
- The cells indicated whether a product was included (1) or not (0)
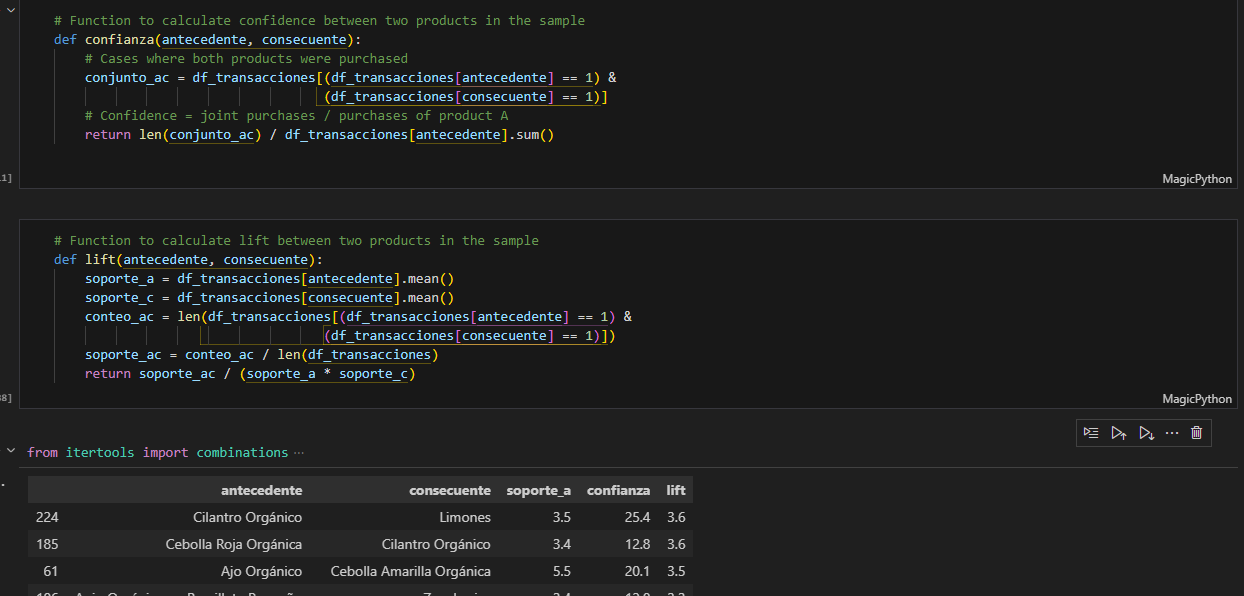
Custom Logic for Confidence and Lift
Rather than using prebuilt association libraries, I developed custom functions to calculate two core metrics of market basket analysis:
- Confidence: Measures the conditional probability of purchasing product B given that product A was purchased.
→ This shows how often a product is bought together with another, helping identify strong pairings. - Lift: Measures the strength of the association between two products compared to random chance.
→ A lift greater than 1 indicates a meaningful relationship beyond coincidence. - Support: The percentage of total transactions in which a product appears. It helps identify the popularity of individual products within the dataset.
→ High support indicates that a product is frequently purchased, making it a strong candidate for bundling.
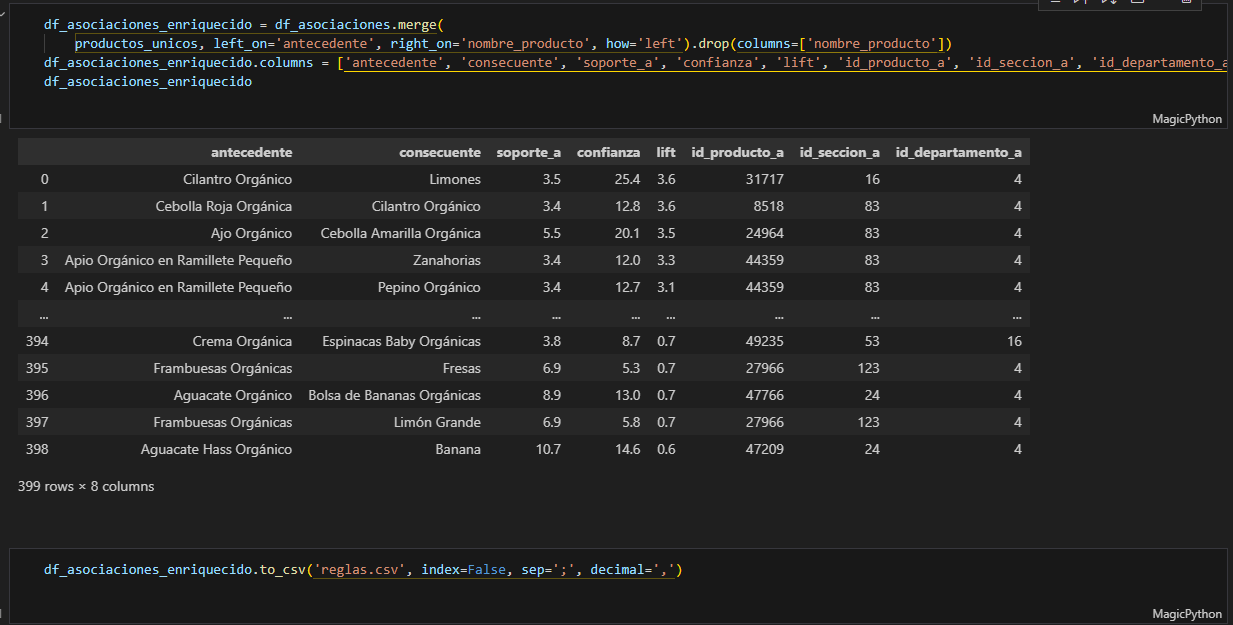
Enriched Output
To make the insights business-relevant, the resulting associations were merged with product metadata (product ID, section, and department). The final output was exported as a CSV file for further use in reports or dashboards.
🎯 Strategic Value
This Python-based solution allowed the company to:
- Understand product affinity patterns
- Optimize product placement and bundling
- Prepare actionable, data-driven recommendations for their business strategy
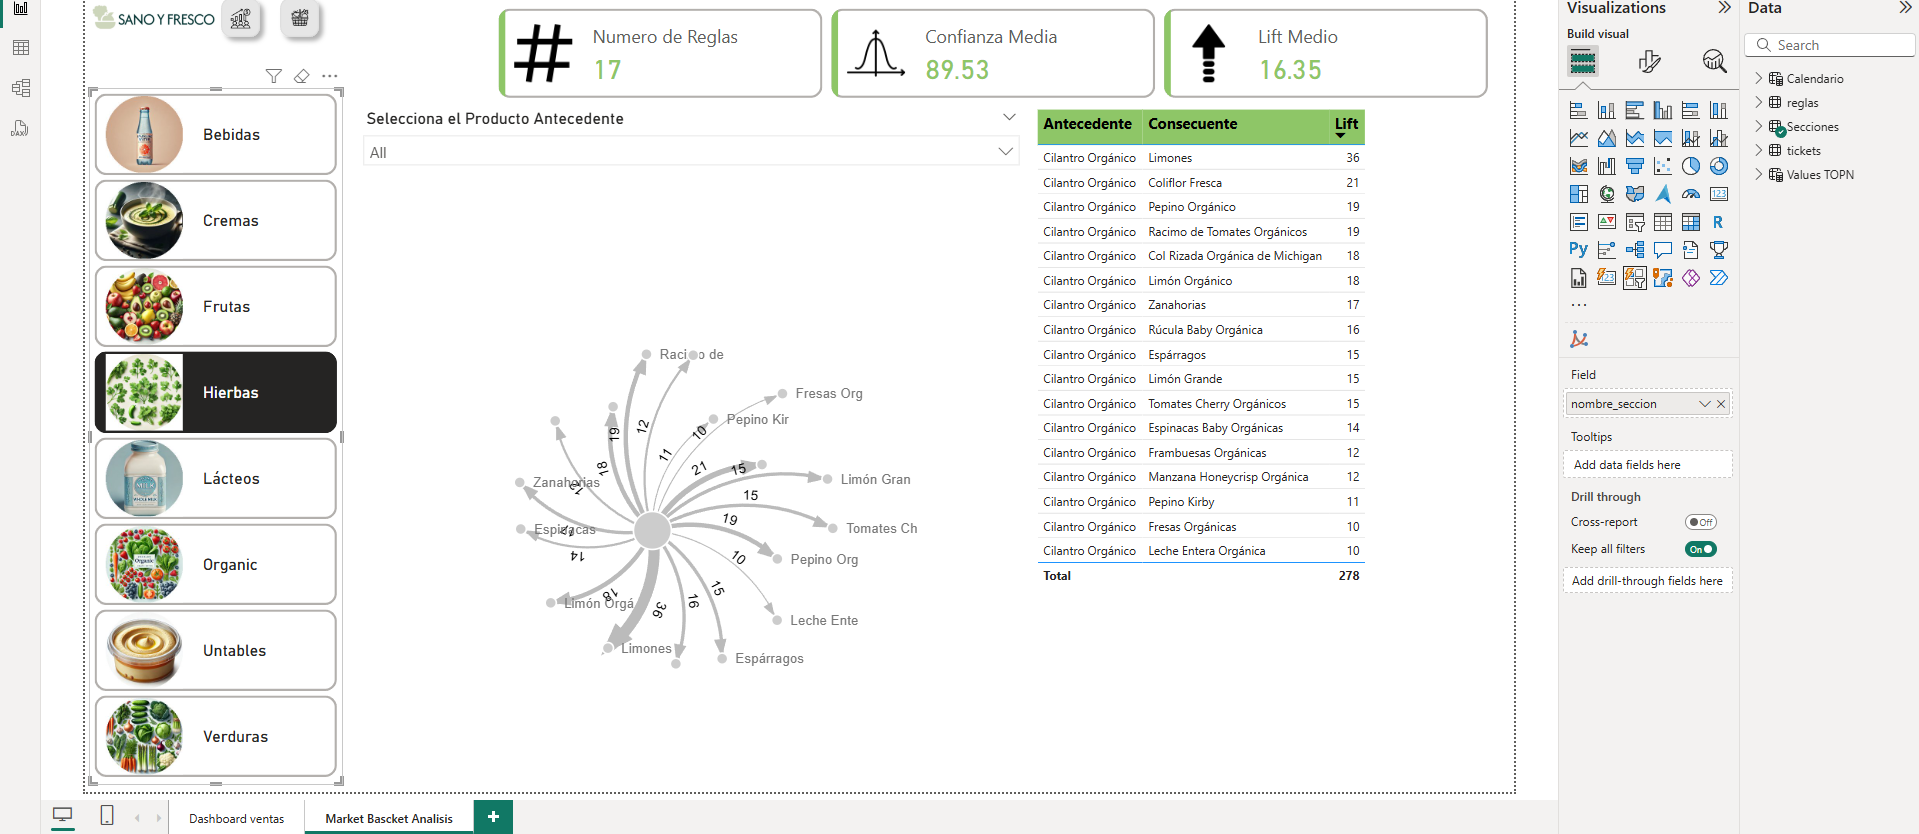
🔹 6. Final Power BI Dashboard
After the Market Basket Analysis was completed in Python, the enriched dataset — containing association rules with product metadata — was integrated into Power BI for visual exploration.
📊 Dashboard Features
- Interactive tables showing the strongest product associations
- Slicers and filters by department, section, and product name
- Visual indicators (color coding or KPI cards) for high-lift rules
-
Dynamic exploration of:
- Top cross-selling opportunities
- Frequently co-purchased items
- Performance by product category or department
🎯 Business Impact
- This final step gave stakeholders a visual, interactive, and strategic tool to:
- Detect hidden product affinities
- Design better bundle promotions
- Optimize store layout or online product recommendations
- Support decision-making with data-driven insights, easily explored in real time